Recently, I'd noticed our Lint CI job was getting painfully slow for our main backend monorepo.
😢 The performance gap was staggering:
- Locally: ~1.2 seconds
- CI: 6 minutes, with some runs taking up to 9 minutes
There was a clear culprit eating up most of this 6 minute run time:
run golangci-lint
[...]
Go packages loading (compiled_files|...) took 4m27.254679062s
[...]
The Go packages loading... step inside golangci-lint was taking ~4.5 minutes all by itself, almost all of it spent waiting for packages.Load to compile our repo's ~736 packages.
🥊 The first problem: untar clashes
I started investigating by looking at our CI logs and immediately spotted error messages during cache restoration for the setup-go Github action:
/usr/bin/tar: ../../../go/pkg/mod/golang.org/x/telemetry/config@v0.31.0/go.mod: Cannot open: File exists
/usr/bin/tar: Exiting with failure status due to previous errors
Warning: Failed to restore: "/usr/bin/tar" failed with error: The process '/usr/bin/tar' failed with exit code 2
Cache is not found
Cache is not found means we're not getting hits on some very important caches that setup-go manages for us (more on that later!).
✅ How did we fix the tar issue?
This was caused by a known bug in Go 1.23.0 which causes a tar error when restoring from cache as per this Github issue.
Solution: Upgrade to Go 1.23.1 or above!
🏃 Did that speed things up?
The tar error goes away 🎉 but this doesn't seem to have any impact on runtimes – and it seems like the setup-go cache still isn't being hit. We still saw "Cache is not found" messages and were stuck on the same achingly long 6 minute waits.
🔐 Why are we still having cache misses after fixing the tar bug?
❌ Could the cache key have changed?
setup-go has a cache key that's defined here as:
 setup-go-${platform}-${arch}-${linuxVersion}go-${versionSpec}-${fileHash}

 where fileHash refers to the hash of the go.sum file
I ran a test with a new PR where I didn't change any Go files, and just added a word to the README. We'd expect this to generate the exact same hash key since no Go files changed. And that's exactly what happened! The cache keys for go-setup are the same across my older PRs and this new PR.
Even with identical cache keys between runs, we kept seeing cache misses, so it can't be the keys.
⬆️ Was the cache actually stored successfully?
So we know that the keys are the same, but we still fail to read the cache back. Maybe it wasn't stored successfully?
From looking at our Github Actions cache, we can see 3 cache results stored for that key, so a cache result definitely existed before we did the second run.
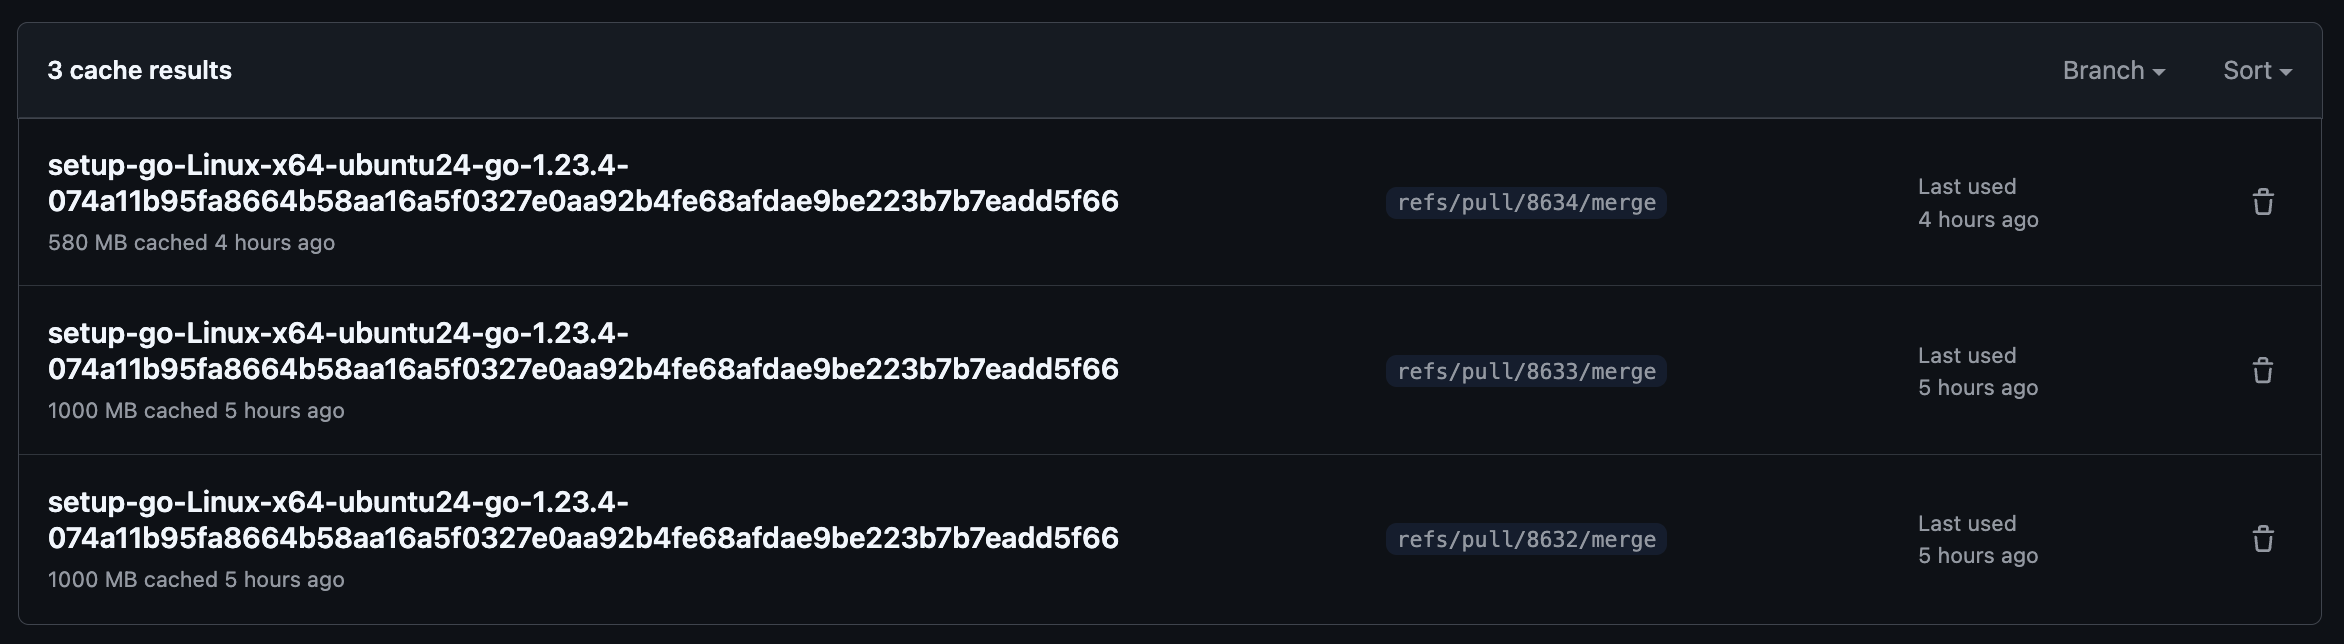
One thing of interest though is that the cache entries are for different branches and pull request numbers...
🔐 Why can't our PR branch see those stored caches?
Turns out, there are some restrictions on when a branch can access another branch's cache:
When a cache is created by a workflow run triggered on a pull request, the cache is created for the merge ref and can only be restored by re-runs of the pull request. It cannot be restored by other pull requests targeting that base branch.
This meant every new PR was isolated from existing caches. To confirm this theory, we pushed another commit to an existing branch that had already created a cache.
🎉 Success! We now see a cache hit in setup-go for the exact same key that had just failed above.
Cache hit for: setup-go-Linux-x64-ubuntu24-go-1.23.4-074a11b95fa8664b58aa16a5f0327e0aa92b4fe68afdae9be223b7b7eadd5f66
🤝 Is there any way for PRs to share caches?
A cache that only works for your individual pull request isn't that useful. Your first CI run for a PR will always have a cache miss, and run super slowly.
Making this worse, we're big fans of stacking PRs using Graphite. Each component of a stack is a separate PR that can't use any of the caches from the PRs below it.
One thing I did notice was that the Go build cache (separate to the setup-go cache) was successfully restored across multiple different PRs.
❓ Why was one cache shared across branches?
There was a Go build cache entry created with the same key against the main branch.
The Github docs clarify why this matters:
Workflow runs can restore caches created in either the current branch or the default branch – usually
main
🎉 So PR branches can share caches that are created against the main branch – but why was it only the Go build cache that had a cache hit on the main branch?
📦 Why weren't there caches on main for any of the other caches?
Go build cache only had a cache hit because there happened to be a main branch entry in the cache. But that raises the question, where are all the main branch entries for our other caches like setup-go?
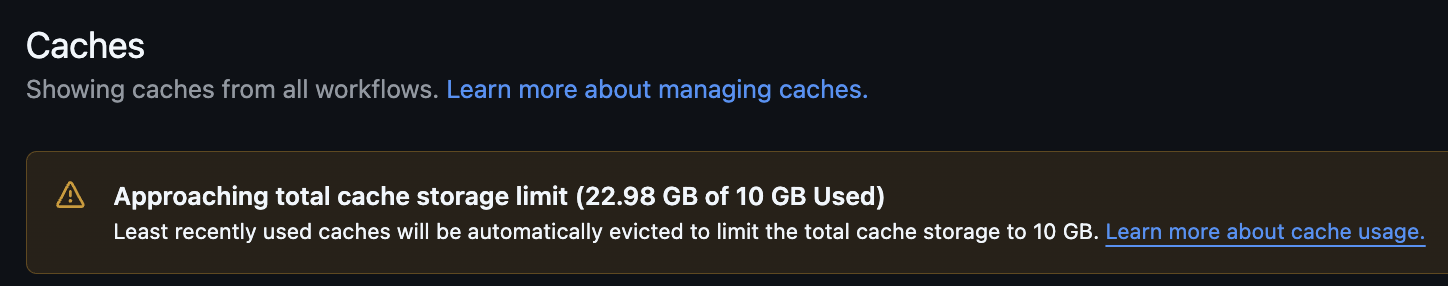
They're being evicted! We have a 10GB non-changeable limit on the Github actions cache, when this is full, Github starts deleting cache entries.
🔍 Let's look into how our 10GB limit is being used
A deep dive into our GitHub Actions cache revealed some shocking waste. What's eating up all our space?
81 total cache entries consuming 30.55GB (well beyond the 10GB limit)
🔴 69 entries (85%) were PR-specific and couldn't be shared between branches
Breaking this down further, we have two main caches in our Lint workflow (I've omitted some smaller, irrelevant ones):
setup-go cache
- This stores
GOMODCACHE(for our dependencies) andGOCACHEfor our compiled Go code - Using 13GB of storage
go build cache
- Also... stores
GOCACHE... - What's the difference between this and the
setup-gocache? Good question! I'll get to that below. - Using 17.55GB of storage
🤏 How can we use our 10GB cache more effectively?
✅ Disable and delete all PR caches
PR caches have an 86.1% cache miss rate, I calculated this using data from gh cache list -L 100
The cache miss rate is probably even higher than this, of the 10 cache hits – 9 were on my test PRs where I was trying to hit the PR cache.
I disabled writing to the cache if we were on a PR branch for actions that had that as a config setting.
For actions that didn't support that, I added a delete-pr-cache workflow step to delete PR caches after every run.
❓Figure out the difference between the setup-go cache, and the go build cache
The go build cache was something we manually added to our Lint workflow, compared to the other caches which are managed by the underlying Github actions themselves.
Our go build cache explicitly saves the GOCACHE folder, with a cache key of:
${{ runner.os }}-gobuild-${{ **hashFiles('**/*.go')** }}
Notice something?
hashFiles('**/\*.go') means that **if we change a single Go file** anywhere in the repo, the cache key will change and we won't get a cache hit.
That means this manual go cache is practically useless – we'd only ever be able to use it if literally no code in the repo had changed.
Also, setup-go already handles caching and restoring GOCACHE – so this was just duplicated storage.
✅ We removed our manually managed go build cache entirely.
🥳 What does our actions cache look like after these changes?
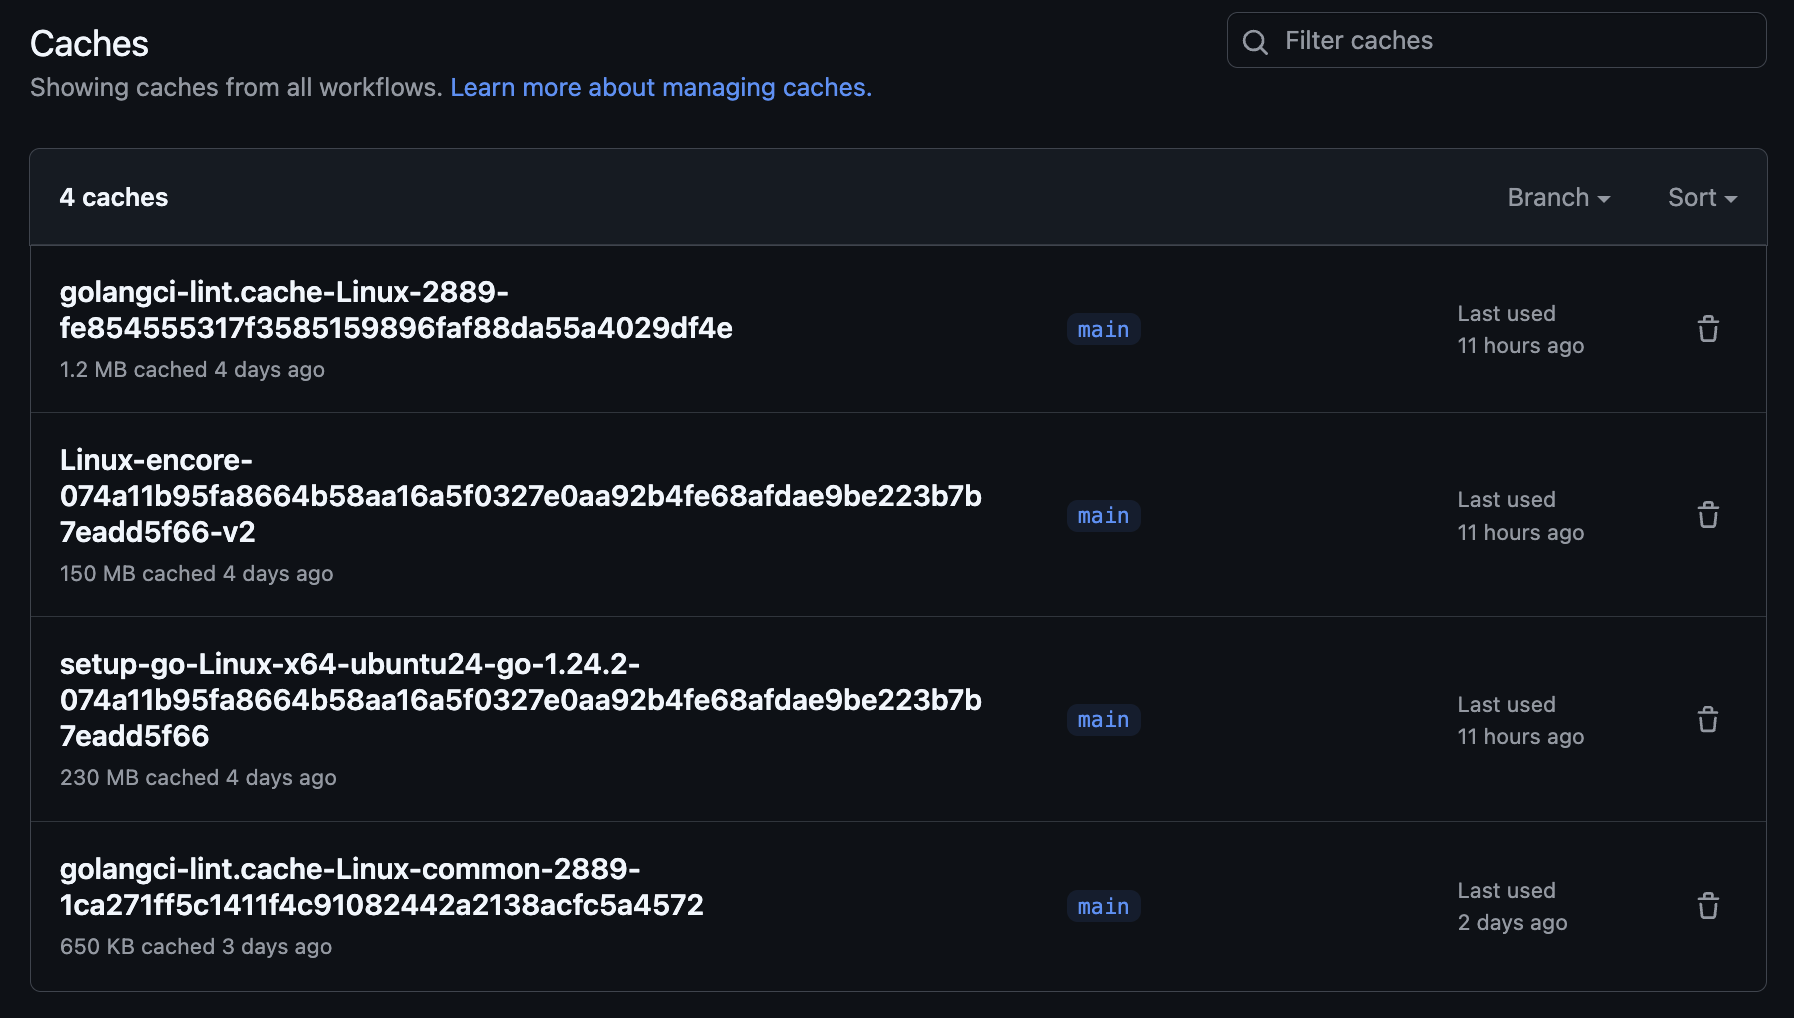
🎉 Our Github actions cache now only stores usable entries from main, and we're down from 23GB to under 1GB.
👎 Did resolving these issues speed up CI?
So, we now have a single setup-go cache with 🎯 consistent cache hits that handles storing GOMODCACHE and GOCACHE.
But our CI still isn't noticeably faster… 😭
We know that it's the Go packages loading... step inside golangci-lint that's the biggest bottleneck. Let's find out which cache matters most for that step.
🎯 Which cache actually affects package loading speed?
Inside the Go packages loading... step, it's the call to the packages.Load function from the Go standard library that takes the longest. I tested this by building a copy of golangci-lint locally and using a debugger to see which function call was slowest.
To find the real bottleneck, I ran experiments locally by selectively clearing different caches:
👎 Testing GOMODCACHE (dependencies):
- No significant impact on package loading speed
💘 Testing GOCACHE (compiled artifacts):
- Clearing GOCACHE: 1.2s → 49s package loading (40x slower!)
- Total runtime: 1.5s → 65s
- Cache rebuilds to 2.8GB after clearing
✨ It's the GOCACHE containing the compiled artifacts for our monorepo's source code that has the biggest impact on package loading time.
The packages.Load function clearly depends heavily on GOCACHE containing compiled artifacts for our source code.
😕 But setup-go is already getting cache hits for GOCACHE...
That's true! We have a fully populated and restored GOCACHE in CI now, but we're still having slow runs...
🍞 Could the setup-go cache be stale?
The setup-go cache key only changes when you update your go version or change go.sum – so it could be that the cache is out of date.
I checked a recent run where the setup-go cache was hit (so this should've populated GOCACHE and GOMODCACHE).
The cache file was created was created 7 hours before the run, so most files won't have changed. But the run still takes the same amount of time (~5 minutes).
⏳ We do need to think of a way to keep the
setup-gocache more fresh – but even with a fresh cache, things are still just as slow.
🤷 Could it be encore wrapper generation?
We have 108 generated encore.gen.go files that get regenerated before we run golangci-lint in CI.
The encore gen wrappers step might invalidate cache entries, but 108 isn't that many, and they're pretty small files (a few KB) – so this doesn't seem likely.
🔴 Could the CI runner be resource constrained?
Maybe the runner is just I/O or memory constrained... the cache is ~14k items and 2.8GB uncompressed.
We can see resource usage coming out of golangci-lint on CI:
Memory: 2565 samples, avg is 49.9MB, **max is 1071.3MB**
So perhaps the runner is failing to load the full set of compiled packages into memory and is then paging to/from disk.
Standard Github CI runners have 2 cores and only 7GB of RAM, so I can see that this might be overly restrictive.
It's non-trivial to get more detailed CPU/memory usage stats out of a Github runner, so let's just test this out experimentally.
💻 Let's try a more powerful machine
We bumped our Lint jobs to use a 4 core, 16GB RAM machine instead of the default.
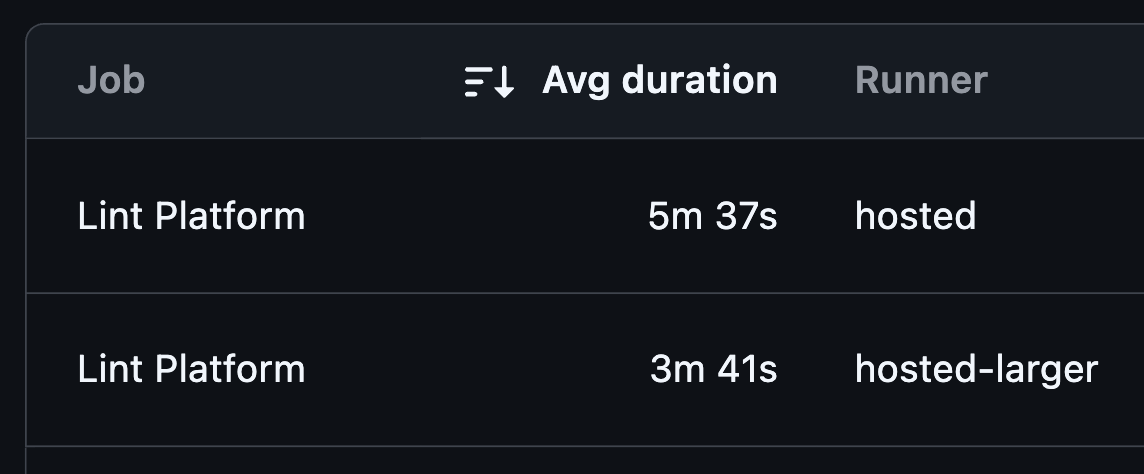
💥 It works!
We've seen a 34% decrease in run time from ~5.5 mins down to ~3.5 mins.
🍎 Why is it still not as fast as running locally?
You might notice that 3.5 mins is still a far cry from the speeds we achieve locally. I have a few theories on why this is:
- CI machines have much slower disk I/O performance so loading the 2.5GB GOCACHE into memory from disk still takes a while
- CI machines have much worse single core performance than our laptops: compiling, traversing, and linting code is often bound by single core performance
- There may be some other issue with our GOCACHE (e.g. we have a path mismatch or the files aren't actually being read by the Go compiler), I think this is unlikely but never say never
I called it a day at this point.
I'm still unhappy, but we can live with ~3 min runtimes for now.
I'm not sure if I can live with an unsolved mystery though! Maybe just one more Saturday debugging... 🏃♂️